Price analysis 8/28: SPX, DXY, BTC, ETH, BNB, XRP, ADA, DOGE, SOL, DOT
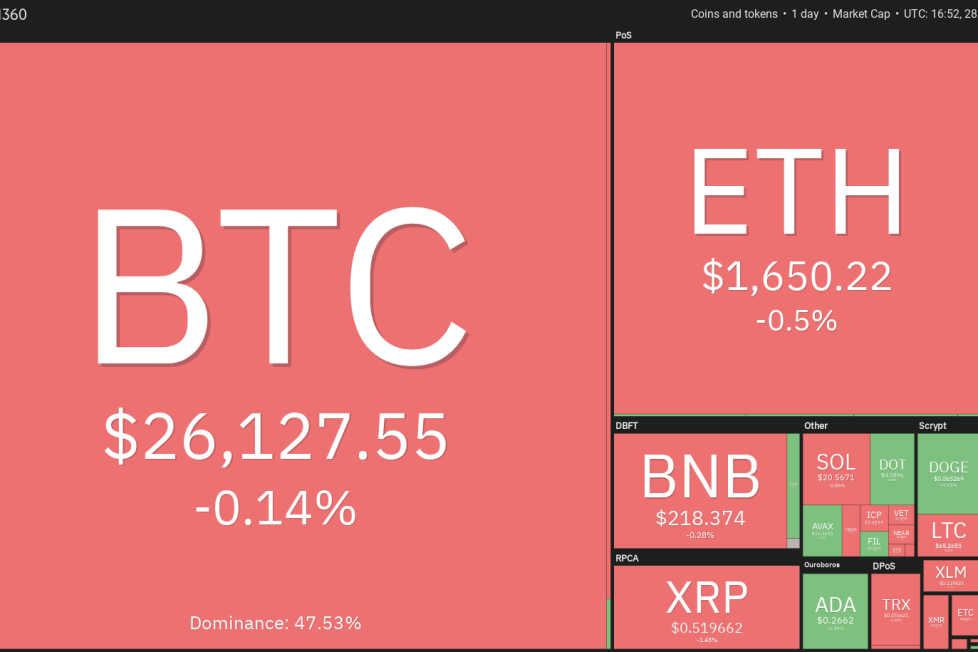


Bitcoin is down about 11% in August,
Dogecoin (DOGE) has been trading between the strong support at $0.06 and the 20-day EMA ($0.07) for the past few days.

The 20-day EMA is sloping down and the RSI is in the negative territory, indicating that the bears have the edge. Sellers will try to sink the price below $0.06 and further strengthen their position.
Time is running out for the bulls. If they want to start a recovery, they will have to quickly drive the price above the 20-day EMA. If they do that, the DOGE/USDT pair could rally to the 50-day SMA ($0.07) and thereafter jump to $0.08.
Solana (SOL) has been gradually drifting lower, indicating that the bears are pouncing on every minor relief rally.

The SOL/USDT pair could drop to the Aug. 22 intraday low of $19.35. If this level caves in, the selling could intensify and the pair may dive to $18 and eventually to the next major support at $15.60.
Contrary to this assumption, if the price turns up and breaks above $22.30, it will indicate solid buying at lower levels. The pair may first rise to the 50-day SMA ($23.61) and thereafter to the strong resistance at $26.
The bulls are trying to shove Polkadot (DOT) above the overhead resistance at the 20-day EMA ($4.64), but they are likely to encounter stiff resistance from the bears.

If the price turns down from the 20-day EMA, it will suggest that the sentiment remains negative and traders are selling on rallies. That could increase the likelihood of a retest of the crucial support at $4.22. If this support crumbles, the DOT/USDT pair may collapse to $4 and later to $3.88.
On the other hand, if buyers kick the price above the 20-day EMA, it will suggest the start of a stronger relief rally to the breakdown level of $5. This level could attract selling by the bears.
This article does not contain investment advice or recommendations. Every investment and trading move involves risk, and readers should conduct their own research when making a decision.