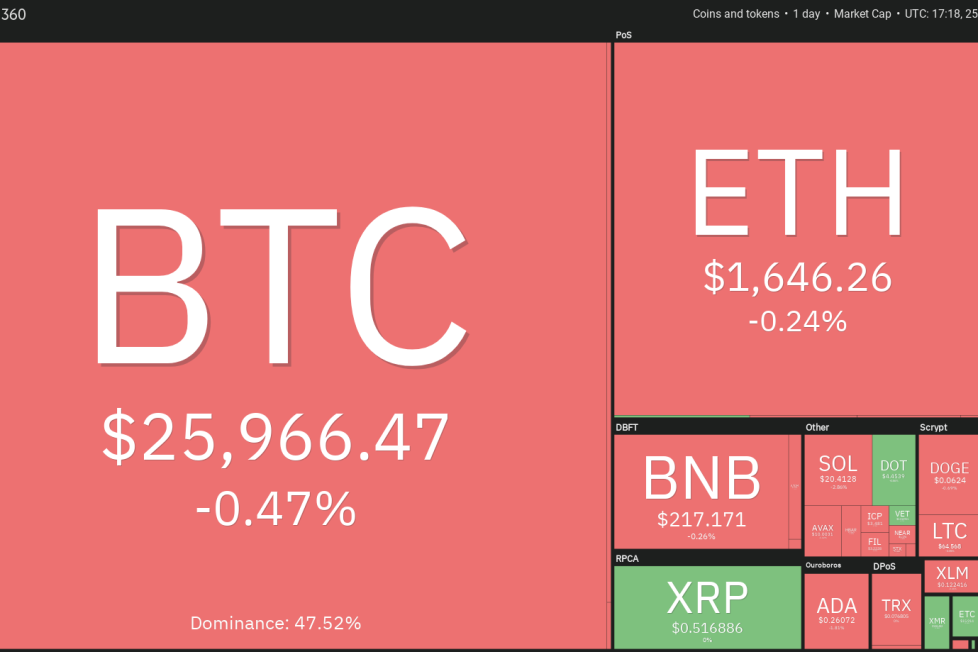
Price analysis 8/25: BTC, ETH, BNB, XRP, ADA, SOL, DOGE, DOT, MATIC, TON


Federal Reserve Chair Jerome Powell spoke on Aug. 25, and in his Jackson Hole speech, he
Polkadot (DOT) has been trading inside a tight range between $4.22 and $4.56 for the past few days. This shows that the bulls successfully defended the support at $4.22 but failed to break above the resistance at $4.56.

A minor positive in favor of the bulls is that they have not given up much ground from the overhead resistance. That enhances the prospects of a break above it. The DOT/USDT pair could first rise to the 20-day EMA ($4.68) and eventually rally to the breakdown level of $5. This level is likely to witness strong selling by the bears.
On the downside, the bulls will have to defend the $4.22 level with all their might because if this support cracks, the pair could start the next leg of the downtrend to $4.
Polygon (MATIC) has been gradually drifting lower toward the vital support at $0.51, indicating that the bears have kept up the pressure.

Although the RSI is in the oversold territory, the bulls have failed to start a rebound. This indicates a lack of demand at the current levels. If the $0.51 level gives way, the selling could intensify and the MATIC/USDT pair could dive to $0.45.
The critical resistance to watch out for on the upside is $0.60. If buyers clear this roadblock, the recovery could reach the 50-day SMA ($0.68). There is a minor resistance at $0.64, but that is likely to be crossed.
Toncoin (TON) has been trying to form a base for the past few days. That has resulted in the formation of an inverse head-and-shoulders pattern, which will complete on a break above $1.53.

The 20-day EMA ($1.35) has started to turn up and the RSI is in positive territory, indicating that the bulls are on a comeback. If buyers shove the price above $1.53, the TON/USDT pair could pick up momentum and start a new up move toward the pattern target of $1.91.
Contrary to this assumption, if the price turns down from the current level, it will indicate that the bears are not willing to relent. That could first pull the price to the moving averages, and if this support breaks, the next stop could be $1.25.
This article does not contain investment advice or recommendations. Every investment and trading move involves risk, and readers should conduct their own research when making a decision.
