Price analysis 8/18: BTC, ETH, BNB, XRP, ADA, SOL, DOGE, DOT, MATIC, LTC
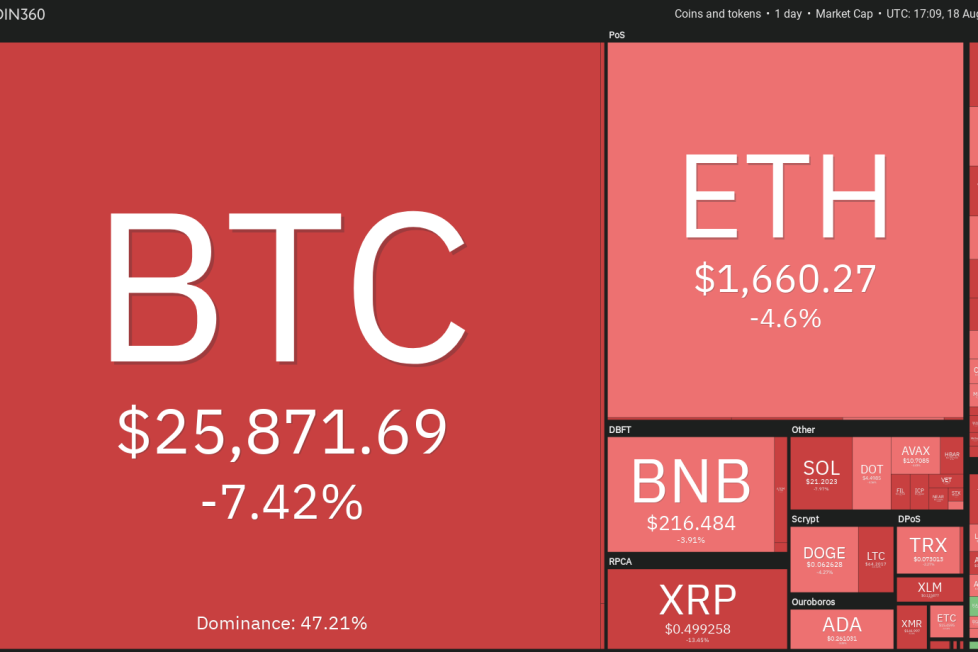


A tight range usually resolves with a range breakout, and that is what happened in Bitcoin on Aug. 17. Bitcoin (
The tight range trading in Polkadot (DOT) expanded to the downside on Aug. 15. That started a decline, which nearly reached the critical support at $4.22 on Aug. 17.

The bulls will try to fiercely defend the $4.22 support, but the recovery is likely to face strong selling at the 20-day EMA ($4.91). If the price turns down from this level, the bears are expected to attack the $4.22 support once again. If this level cracks, the DOT/USDT pair may start the next leg of the downtrend.
Alternatively, if the price turns down from the 20-day EMA but rebounds off $4.22, it will suggest that the pair may consolidate for a few days. The bulls will gain momentum after the price rises above the moving averages.
Polygon’s (MATIC) break below the $0.65 support attracted aggressive selling, which tugged the price below the next strong support at $0.60 on Aug. 17.

The bulls bought the dip near $0.50, indicating strong demand at lower levels. However, buyers may face selling at $0.60 and again at the 20-day EMA ($0.66). If the price turns down from the overhead resistance, the MATIC/USDT pair may retest the vital support at $0.50.
If this support gives way, the pair could slip to $0.45 and then to $0.42. On the upside, the bulls will have to kick the price above the moving averages to indicate that the downtrend could be ending.
Litecoin (LTC) went into a tailspin after breaking below the support at $81 on Aug. 15. The price crumbled to $56 on Aug. 17.

The sharp descent of the past few days has sent the RSI into oversold territory. This suggests that a minor recovery or consolidation is likely in the near term. The relief rally could face selling in the zone between the 50% Fibonacci retracement level of $70 and the 61.8% retracement level of $74.
If the price turns down from the overhead resistance, the LTC/USDT pair could form a range for a few days. A break and close below the pivotal level of $56 could extend the decline to $50.
This article does not contain investment advice or recommendations. Every investment and trading move involves risk, and readers should conduct their own research when making a decision.