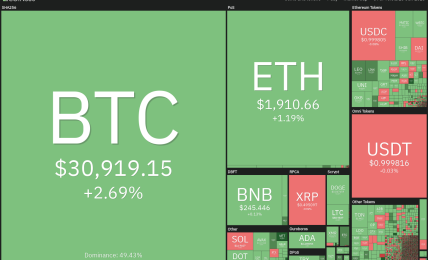
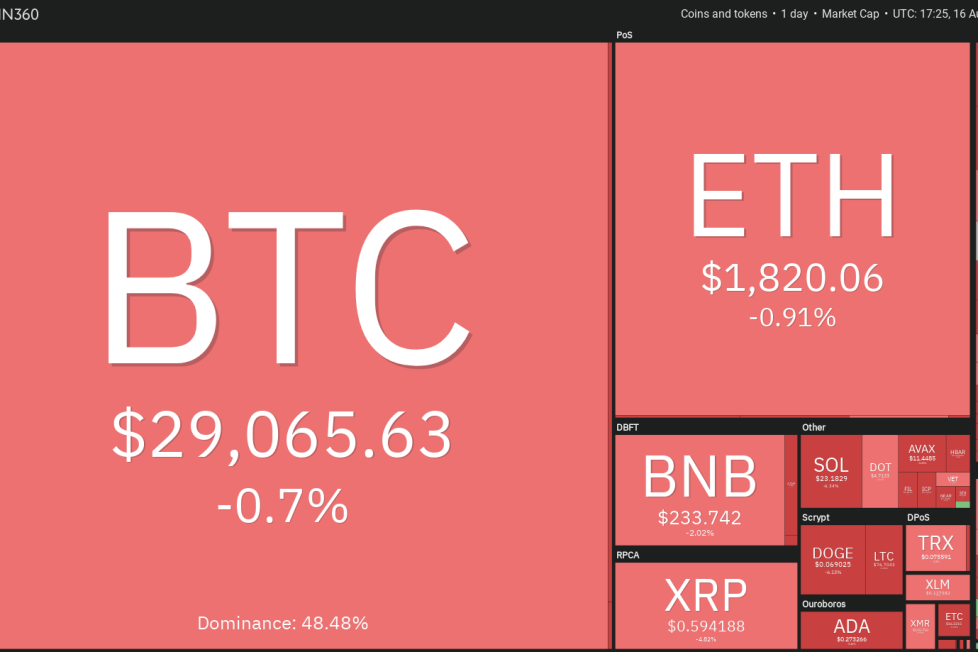
Price analysis 8/16: BTC, ETH, BNB, XRP, DOGE, ADA, SOL, MATIC, LTC, DOT


Bitcoin continues to trade inside a narrow range with no clear signs of a breakout from it. Trading platform QCP Capital said in its latest market update that Bitcoin (
The repeated failure of the bulls to propel Polygon (MATIC) above the 20-day EMA ($0.68) may have intensified selling. That pulled the price below the support near $0.65 on Aug 15. The next support to look for on the downside is $0.60.

The RSI is nearing the oversold levels, indicating that the selling may have been overdone in the near term. Buyers will try to start a rebound that could reach $0.65 and then the 50-day SMA ($0.70).
If the price turns down from the overhead resistance, it will signal that bears have the upper hand. That could increase the likelihood of a drop below $0.60. The pair may then nosedive toward $0.50.
If the bulls want to make a comeback, they will have to kick and sustain the price above the moving averages.
Litecoin (LTC) tumbled and closed below the strong support at $81.36 on Aug. 15, indicating that the bears are in command.

The RSI is in the oversold territory, indicating that a consolidation or a bounce may be around the corner. The bulls may try to defend the uptrend line. If the price snaps back from this level, it could face selling at $81.36 and then again at the downtrend line.
If the LTC/USDT pair turns down from the overhead obstacle, it will indicate that the sentiment remains negative and traders are selling on rallies. That will increase the possibility of a drop to $70.
The first sign of strength will be a break and close above the downtrend line. That could clear the path for a possible rally to the 50-day SMA ($91.70).
The failure of the bulls to achieve a strong bounce off the $5 support in Polkadot (DOT) may have attracted selling by the bears. That tugged the price below the support on Aug. 15.

The bulls purchased the dip below the next support at $4.74, but they are struggling to sustain the recovery. This suggests that the bears continue to sell on every minor relief rally. If the price continues lower and dips below $4.60, it will suggest that the DOT/USDT pair is in a firm bear grip. That could result in a decline to $4.22.
Buyers are likely to fiercely defend the zone between $4.22 and $4.37. On the upside, the bulls will have to thrust the price above the 50-day SMA ($5.16) to signal a comeback. The pair could then surge to the downtrend line.
This article does not contain investment advice or recommendations. Every investment and trading move involves risk, and readers should conduct their own research when making a decision.