Price analysis 8/14: SPX, DXY, BTC, ETH, BNB, XRP, ADA, DOGE, SOL, MATIC


Bitcoin has been stuck inside a tight range in August. Glassnode lead on-chain analyst Checkmate highlighted that the spread between the upper and lower Bollinger Bands for Bitcoin has shrunk to 2.9%, its
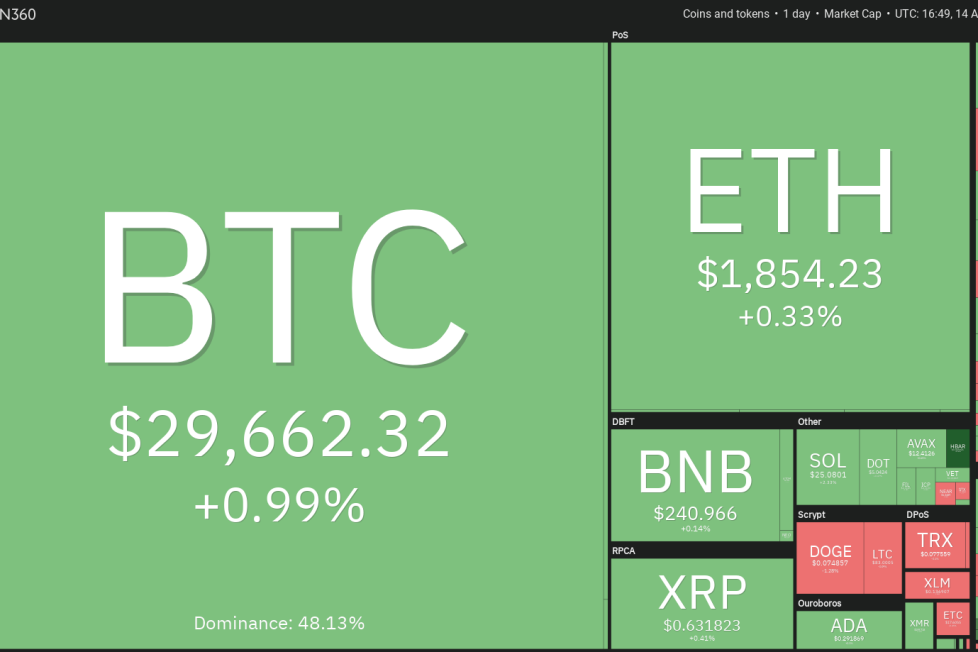
Dogecoin’s (DOGE) recovery was rejected at the downtrend line on Aug. 13, indicating that the bears are fiercely defending this level.

The price has reached the support line of the ascending channel, which is an important level to keep an eye on. If the price plummets below the support line, the DOGE/USDT pair could tumble to $0.07.
Contrarily, if the price turns up from the current level and breaks above the downtrend line, it will signal that the bulls remain buyers at lower levels. The pair could first rise to $0.08 and later to the resistance line of the channel at $0.09.
Solana (SOL) is trading inside the range between $22.30 on the downside and $26 on the upside. A minor advantage in favor of the bulls is that the price is trading above the 20-day EMA ($24.09).

If the current bounce sustains, the bulls will try to drive the SOL/USDT pair above the overhead resistance at $26. If they succeed, the pair could pick up momentum and climb to $29.12 and later to $32.13.
Alternatively, if the price turns down from $26, it will suggest that the pair may extend its stay inside the range for a few more days. The bears will have to yank the price below $22.30 to come out on top.
The bulls are finding it difficult to push Polygon (MATIC) above the 20-day EMA ($0.69), but a positive sign is that they have not ceded ground to the bears.

The moving averages are flattening out and the RSI is just below the midpoint, indicating a balance between supply and demand. This balance could tilt in favor of the bulls if they propel the price above the 50-day SMA ($0.70). The MATIC/USDT pair could then attempt a rally to $0.80.
On the contrary, if the price turns down from the 50-day SMA, it will signal that bears are active at higher levels. That may keep the pair stuck inside a range for a few days. The bears will have to sink and sustain the price below the support near $0.65 to gain the upper hand. The pair could then slide to $0.60.
This article does not contain investment advice or recommendations. Every investment and trading move involves risk, and readers should conduct their own research when making a decision.