Price analysis 8/9: BTC, ETH, BNB, XRP, DOGE, ADA, SOL, MATIC, LTC, DOT
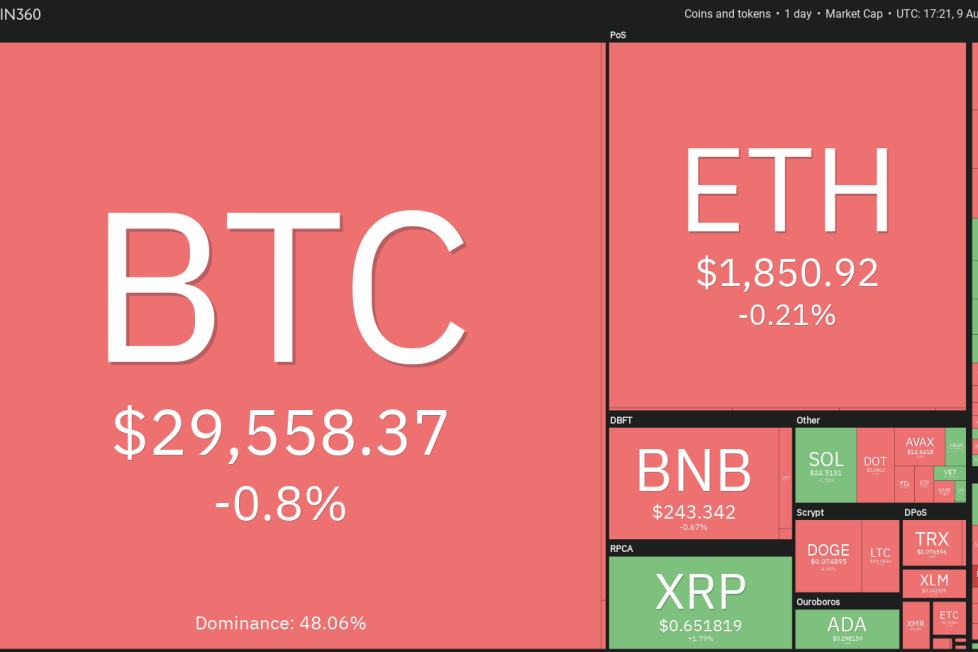


Bitcoin’s rebound off $28,701 on Aug. 7 shows that lower levels continue to attract buyers. The recovery has kept the price stuck inside the range as traders await the start of a new trending move. A recent report by ARK Invest says that “Bitcoin’s volatility dropped to a 6-year low during July.”
Traders who expected a strong move in either direction have been disappointed by the
Polygon (MATIC) bounced off the strong support at $0.64 and reached the moving averages, where the bears are expected to mount a strong defense.

If the price turns down from the moving averages, the MATIC/USDT pair could once again drop to $0.64. A bounce off this level could keep the pair range-bound between $0.64 and the moving averages for some time. The flattish moving averages and the RSI just below the midpoint also suggest range-bound action.
On the contrary, if bulls drive the price above the moving averages, it will suggest the start of a stronger recovery to $0.74 and then to $0.80.
The bears tried to sink Litecoin (LTC) below the support at $81.36 on Aug. 7, but the long tail on the candlestick shows strong demand at lower levels.

The bulls are trying to start a recovery, which is likely to face strong selling near the 20-day EMA ($87). If the price turns down from this level, it will suggest that the sentiment remains negative and traders are selling on rallies. The bears will then make one more attempt to sink the LTC/USDT pair below $81.36.
If bulls want to make a comeback, they will have to kick the price above the 20-day EMA. If they succeed, it could open the doors for a possible rise to the 50-day SMA ($92) and later to $96.46.
Polkadot (DOT) has been trading between $5 and $5.65 for many days. Efforts to push the price above and below the range have been unsuccessful, indicating that bulls are buying the dips and bears are selling on rallies.

The bulls are trying to push the price above the moving averages but are facing stiff resistance from the bears. If the price turns down from the moving averages, it will increase the likelihood of a break below $4.83. If that happens, the DOT/USDT pair could descend to $4.60.
Alternatively, if bulls propel the price above the moving averages, it will suggest that the range remains intact. The pair could rise to $5.33 and subsequently to the overhead resistance at $5.64.
This article does not contain investment advice or recommendations. Every investment and trading move involves risk, and readers should conduct their own research when making a decision.