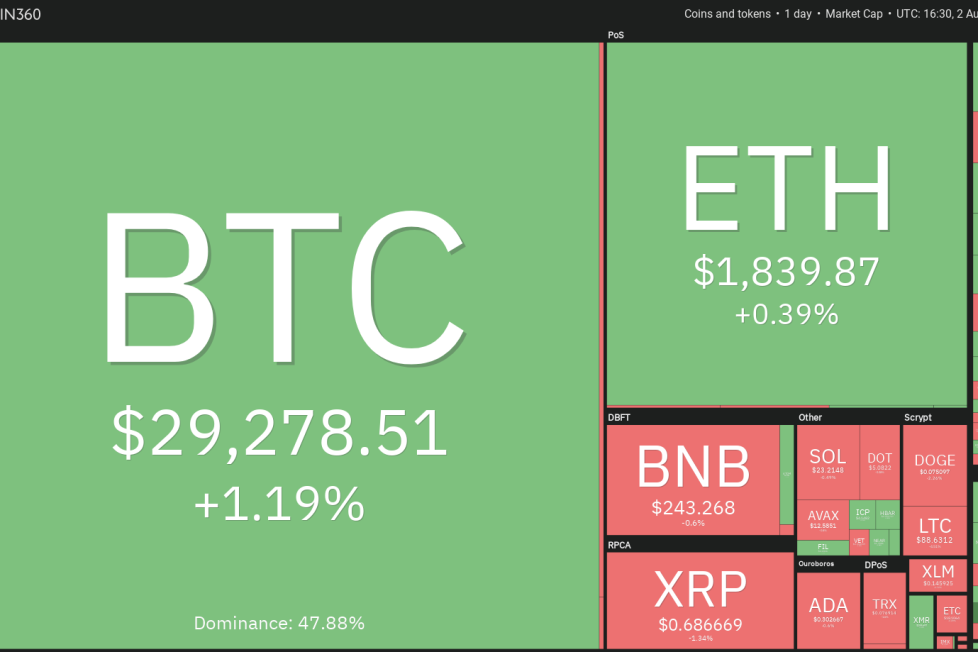
Price analysis 8/2: BTC, ETH, BNB, XRP, DOGE, ADA, SOL, MATIC, LTC, DOT


Ratings agency Fitch
Polygon (MATIC) has been gradually pulling down lower. The bears tugged the price below the 50-day SMA ($0.69) on July 31, but the bulls pushed the price back above the level on Aug. 1.

The gradually downsloping 20-day EMA ($0.72) and the RSI below 44 indicate that bears have a slight advantage. If the price turns down and breaks below $0.65, the selling could pick up and the MATIC/USDT pair may decline to $0.60.
This negative view will invalidate in the near term if the price turns up from the current level and breaks above the 20-day EMA. That could open the gates for a possible rally to $0.80. This level may prove to be a stiff barrier, but if bulls overcome it, the pair could reach $0.90.
Litecoin (LTC) bounced off the strong support at $87 on Aug. 1. This shows that the price remains stuck inside the range between $87 and $97.

The 20-day EMA ($92) remains flat and the RSI is just below the midpoint, indicating a balance between supply and demand. This equilibrium will shift in favor of the bears if they sink the price below $87. The LTC/USDT pair could then drop to $81 and later to $75.
Contrary to this assumption, if the price turns up from $87, it will suggest that the pair may extend its stay inside the range for a few more days. The bulls will have to drive the price above $97 to start an up move to $106.
The bears tried to resolve the uncertainty in Polkadot (DOT) in their favor on Aug. 1, but the bulls thwarted their attempt.

A minor positive in favor of the bears is that they did not allow the bulls to kick the price above the 20-day EMA ($5.21). This suggests that higher levels continue to attract selling by the bears.
The important support to watch on the downside is the 50-day SMA. If the price sustains below this level, the selling could intensify and the DOT/USDT pair may slump to $4.74 and then to $4.65.
Contrarily, a rise above the 20-day EMA may enhance the prospects of a rally to the overhead resistance at $5.64.
This article does not contain investment advice or recommendations. Every investment and trading move involves risk, and readers should conduct their own research when making a decision.
