Price analysis 7/31: SPX, DXY, BTC, ETH, XRP, BNB, ADA, DOGE, SOL, LTC


The S&P 500 Index continued its march toward its all-time high with a 3% gain in July. Signs of receding inflationary pressures and expectations of an end to the Federal Reserve’s tightening cycle are the factors that boosted risk-on sentiment.
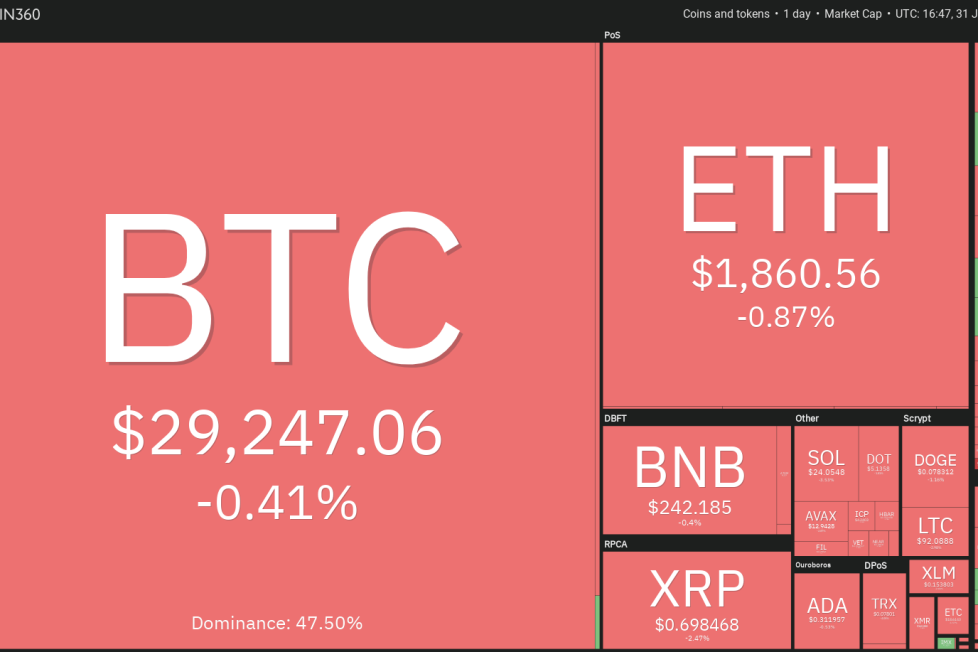
However, this bullish mood did not benefit Bitcoin (
Dogecoin (DOGE) is facing selling just above the $0.08 level, but a minor positive is that the bulls have not ceded ground to the bears. This suggests that the buyers expect another leg higher.

The upsloping 20-day EMA ($0.07) and the RSI in the positive territory indicate that the bulls have the upper hand. If the price turns up from the 20-day EMA, the bulls will again attempt to drive the DOGE/USDT pair above the overhead resistance. If they succeed, the pair may start its northward march to $0.10 and eventually to $0.11.
Alternatively, if the price turns down and breaks below the 20-day EMA, it will suggest that the bulls are losing their grip. The pair may then slide to the breakout level at $0.07.
Solana (SOL) is trying to find support at the 20-day EMA ($24.14), but the bulls are struggling to sustain the rebound. This suggests that the bears have not given up.

If the price cracks and maintains below the 20-day EMA, the SOL/USDT pair may slide to $22.30. This remains the key short-term support to watch out for. If the price rebounds off this level, the pair may consolidate between $22.30 and $27.12 for some time. The flattening 20-day EMA and the RSI near the midpoint also suggest a range formation in the near term.
A break and close above $27.12 will signal that bulls are back in the driver’s seat. The pair may then rally to $32.13. On the downside, a break below $22.30 could pull the pair to the 50-day SMA ($20.71).
Buyers pushed Litecoin (LTC) above the 20-day EMA ($92) on July 29, but they could not clear the hurdle at $97.

The flattish 20-day EMA and the RSI just below the midpoint indicate the possibility of a range formation. Buyers purchased the dip on July 30, as seen from the long tail on the candlestick, but they failed to build upon the strength on July 31. This suggests that bears are aggressively defending the $97 level.
If the price tumbles below the 50-day SMA ($91), the LTC/USDT pair could descend to $87. A strong bounce off this level may keep the pair range-bound for a few days. Buyers will have to propel the price above $97 to open the doors for a rally to $106.
This article does not contain investment advice or recommendations. Every investment and trading move involves risk, and readers should conduct their own research when making a decision.