Ether death cross threatens more downside as ETH price trades at a key support level


Ether’s price fell this week, and several data points are beginning to suggest that further downside could be in store.
On July 24, Ether (
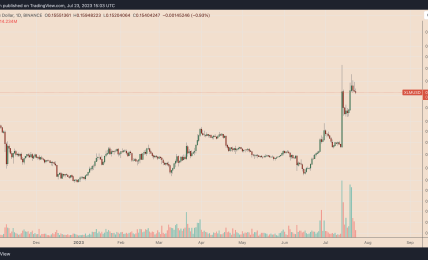
Technically, the ETH/USD pair shows bearish risk in the short term with an impending death cross on the weekly scale.
Ether has witnessed only one death cross between the 50- and 200-period moving averages (MAs) on a weekly scale in the past in June 2019, after which its price dropped 60%.

On the daily chart, the ETH/USD pair threatens a fall toward the 200-day MA at $1,761, which also coincides with the lower highs from November 2022.

The derivatives data for ETH indicates that there has been no significant change in the open interest volume for futures contracts, which reflects the demand for these contracts. This suggests that traders are currently not showing much interest in the recent lackluster price action.
Looking at the options data from Deribit reveals that contracts worth $1.1 billion are set to expire on July 28. The positioning in the options market indicates a bullish bias, with a notable concentration of call options between $1,900 and $2,400.
As the expiration date approaches, it is likely that the price will remain subdued around the maximum pain level for options buyers, which is at $1,850.
Based on the on-chain and market indicators, it appears that Ether’s negative selling pressure could persist for a couple of weeks. However, there is potential for a strong influx of buyers, particularly at support levels of $1,700 and $1,500.
This article does not contain investment advice or recommendations. Every investment and trading move involves risk, and readers should conduct their own research when making a decision.
This article is for general information purposes and is not intended to be and should not be taken as legal or investment advice. The views, thoughts, and opinions expressed here are the author’s alone and do not necessarily reflect or represent the views and opinions of Cointelegraph.