Price analysis 5/26: BTC, ETH, BNB, XRP, ADA, DOGE, MATIC, SOL, DOT, LTC
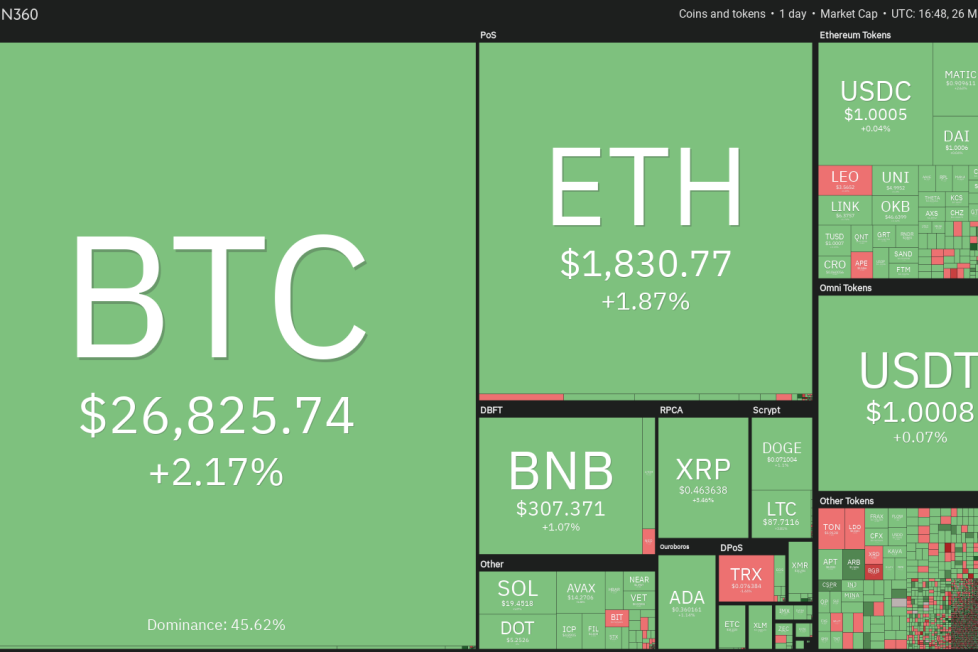

Bitcoin remains pinned below $27,000, and the recent weakness of the past few days has increased calls from analysts for a fall to the low $20,000 levels. While anything is possible, the bulls are unlikely to give up the $25,000 support without putting up a fight.
Glassnode’s lead on-chain analyst Checkmate said in his comments on May 24 that the sell-side risk ratio metric suggests that “sellers are exhausted on both sides,” and that indicates big moves “are coming.” The last time the sell-side risk ratio was this low was in late 2015, which
The bulls managed to protect the $18.70 support on May 24 and 25, but they could not start a strong relief rally in Solana (SOL). That indicates a lack of demand at higher levels.
Time is running out for the bulls. If they do not start a recovery quickly, the bears will try to strengthen their position further by yanking the price below the $18.70 support. If they do that, the SOL/USDT pair could start its southward journey toward $16.
The first sign of strength will be a break and close above the downtrend line. The pair could then rise to the 50-day SMA ($21.65). If this level is surmounted, it will suggest the start of an up move toward $27.12.
Polkadot’s (DOT) shallow bounce off the strong support at $5.15 on May 25 and 26 shows a lack of aggressive buying by the bulls. The bears will try to use this opportunity and build upon their advantage.
If the price slips below $5.15, the DOT/USDT pair could pick up momentum and tumble toward the next major support at $4.22.
If bulls want to prevent a decline, they will have to quickly drive the price above the 20-day EMA ($5.40). If they manage to do that, it will suggest that the buyers are trying to form a higher low at $5.15.
The pair could first rise to the 50-day SMA ($5.82) and subsequently dash toward the downtrend line. A break above this level will suggest that the corrective phase may be over.
Litecoin (LTC) has been range-bound between $96 and $75 for the past few days. The price action inside the range can be random and volatile.
The bulls started a recovery on May 25, which has reached the moving averages. If the price turns down from the current level, the next stop could be the uptrend line. If the price turns up from the uptrend line, it will suggest that the LTC/USDT pair is attempting to form a symmetrical triangle pattern.
If the price breaks above the moving averages, it will suggest that the short-term sentiment is turning positive. The pair could then attempt a rally to $96, where the bears may again mount a strong resistance.
This article does not contain investment advice or recommendations. Every investment and trading move involves risk, and readers should conduct their own research when making a decision.
This article is for general information purposes and is not intended to be and should not be taken as legal or investment advice. The views, thoughts, and opinions expressed here are the author’s alone and do not necessarily reflect or represent the views and opinions of Cointelegraph.