Watch these 5 cryptocurrencies for a potential price rebound next week

Traders dumped risky assets following the crisis and failure of Silicon Valley Bank. The S&P 500 Index plunged 4.55% while Bitcoin (
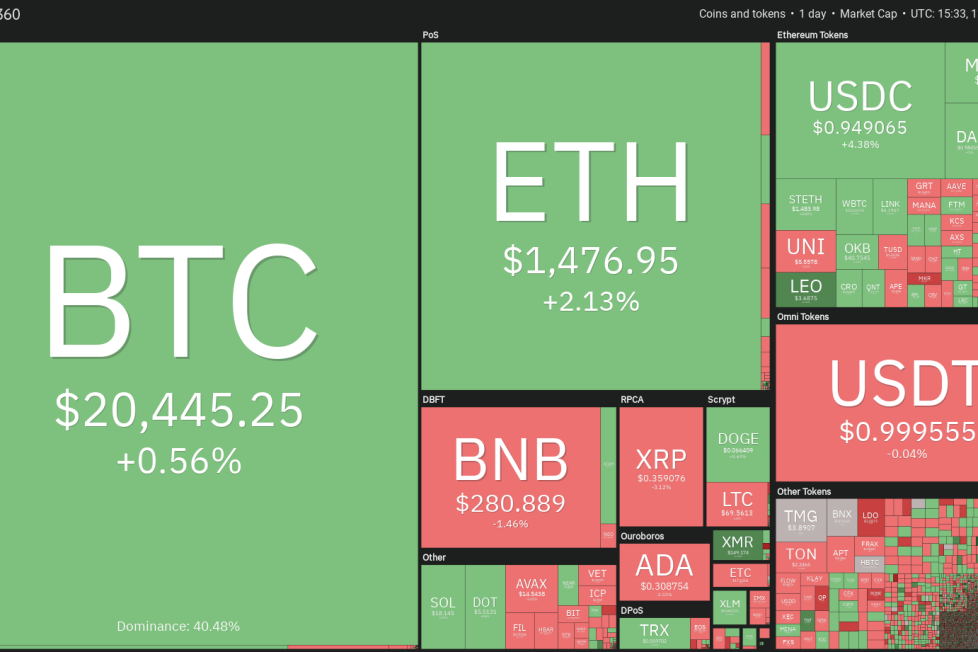
While most major cryptocurrencies have fallen to or below their 200-day SMA, Toncoin (TON) is still way above the level. This suggests that traders are not rushing to the exit.
The TON/USDT pair has formed a symmetrical triangle pattern near the local high. The price action inside the triangle is random and volatile.
Typically, the triangle acts as a continuation pattern. That means the trend that was in force before the formation of the setup resumes. In this case, if buyers kick the price above the resistance line of the triangle, the pair may start a move toward $2.90.
Conversely, if the price continues lower and plummets below the triangle and the 200-day SMA ($1.90), it will suggest that bears are in command. That may pull the price toward $1.30. Such a move will indicate that the triangle behaved as a reversal setup.
The downsloping 20-EMA and the RSI in the negative territory on the four-hour chart show that bears have the upper hand. If the price turns down from the current level and breaks below $2.18, the drop is likely to extend to $2.
Contrarily, if bulls drive and sustain the price above the 20-EMA, it will suggest that bulls are attempting a comeback. The pair may then rise to $2.45 where the bears may mount a strong defense. If this level is crossed, the bulls try to pierce the triangle near $2.50.
OKB (OKB) is in a corrective phase but a minor positive in favor of the bulls is that it is way above its 200-day SMA ($26).
The next support on the downside is the 50% Fibonacci retracement level of $36.13 and then the 61.8% retracement level of $30.76. The bulls are likely to protect this zone with all their might.
If the price turns up from this zone, the OKB/USDT pair may rise to the 20-day EMA ($45.48). This is an important level to keep an eye on because a break and close above it will signal that the corrective phase may be over.
On the other hand, if the price slips below $30.76, it will suggest that traders are rushing to the exit. The pair may then plunge to the 200-day SMA.
The downsloping 20-EMA and the RSI in the negative territory on the four-hour chart suggest that bears have the upper hand. There is minor support near $37.50 but if it gives way, the pair may reach $36.13.
On the contrary, if the price turns up and breaks above the 20-EMA, it will suggest that bulls are trying to regain control. The pair may then rise to $44.35. This is an important resistance for the bears to guard because if it gets taken out, the price could reach $50.
This article does not contain investment advice or recommendations. Every investment and trading move involves risk, and readers should conduct their own research when making a decision.