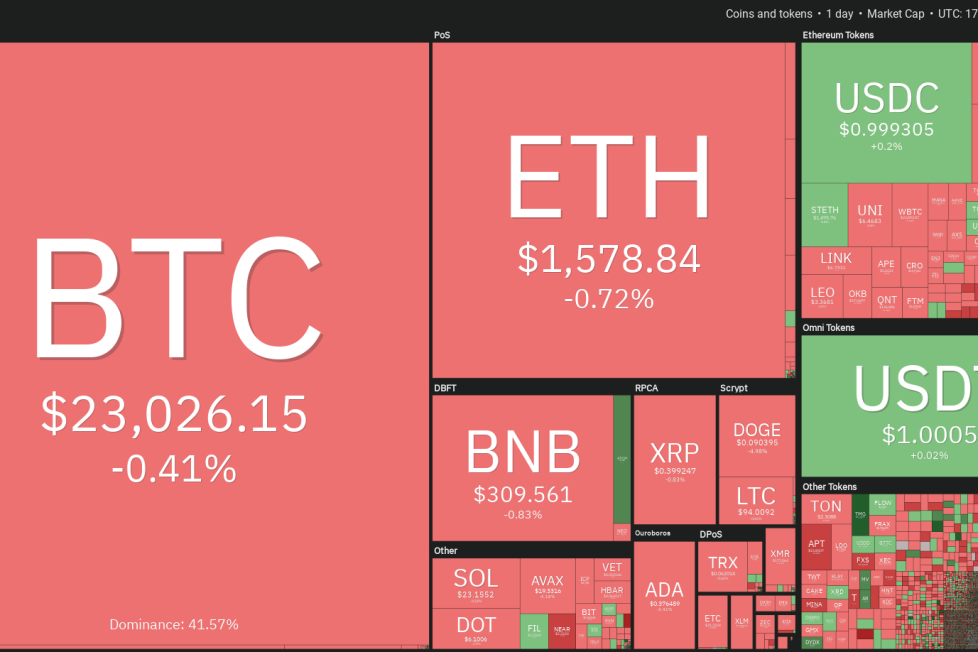
Price analysis 2/1: BTC, ETH, BNB, XRP, ADA, DOGE, MATIC, DOT, LTC, AVAX

Bitcoin (
Litecoin (LTC) bounced off the 20-day EMA ($88) on Jan. 30, indicating that the uptrend remains intact and lower levels are attracting buyers.
The upsloping 20-day EMA and the RSI in the positive zone indicate an advantage to buyers. The LTC/USDT pair could first reach $100, where the bears may again mount a strong resistance. If bulls do not give up much ground from this level, the pair could continue its northward march toward $107.
The first sign of weakness will be a break and close below the 20-day EMA. That could indicate profit-booking by short-term traders. The pair could then slide to $81.
Although the bulls pushed Polkadot (DOT) above the resistance line on several occasions in the past few days, they could not sustain the higher levels. This shows that the bears are fiercely defending this level.
The sellers will try to increase their dominance by pulling the price below the 20-day EMA ($6.04) while the bulls will attempt to protect the support. If bears come out on top, the DOT/USDT pair could start a deeper correction to $5.50 and then to the 50-day SMA ($5.24).
In case the bulls successfully defend the 20-day EMA, it could increase the likelihood of a rally above the overhead resistance at $6.84. The pair could then accelerate toward $8 with a brief stop at $7.42.
Avalanche (AVAX) turned down from the horizontal resistance at $22 on Jan. 28 and dropped to the breakout level from the resistance line on Feb. 1.
The 20-day EMA ($17.87) is just below the resistance line hence it is likely to act as a strong support. If the price rebounds off this support zone, it will indicate that the sentiment is positive and traders are buying on dips. The bulls will then attempt to thrust the AVAX/USDT pair above $22 and start a rally toward $30.
The bears are likely to have other plans. They will try to pull the price below the 20-day EMA. If they do that, the pair could slide toward the 50-day SMA ($14.41).
This article does not contain investment advice or recommendations. Every investment and trading move involves risk, and readers should conduct their own research when making a decision.
