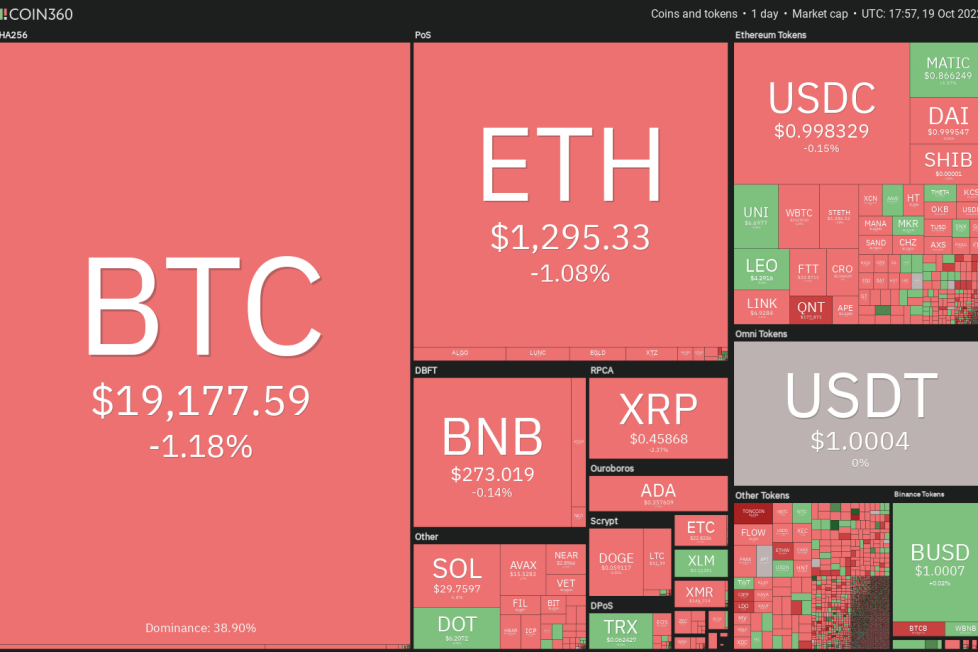
Price analysis 10/19: BTC, ETH, BNB, XRP, ADA, SOL, DOGE, DOT, MATIC, SHIB

The lack of a decisive catalyst and the strength in the United States Dollar Index (DXY) has kept the recovery of risky assets under check. Bitcoin (
Buyers failed to push Polkadot (DOT) above the 20-day EMA ($6.27) on Oct. 17 and 18, indicating that the bears are vigorously defending this level.
The sellers will try to further cement their advantage by pulling the price below the vital support at $6. If they succeed, the selling could accelerate and the DOT/USDT pair could decline to $5.68. If this level also cracks, the next stop could be $5.36.
Alternatively, if the price rebounds off $6 with force, it will indicate that the bulls are accumulating on dips. Buyers will then again try to clear the overhead hurdle at the 20-day EMA and push the price toward $6.64.
Polygon (MATIC) broke and closed above the downtrend line on Oct. 17. This indicates the start of a sustained recovery in the near term.
The MATIC/USDT pair could rise to $0.94 where the bears may mount a strong defense. If the price turns down from this level but rebounds off the 20-day EMA ($0.81), it will suggest that the sentiment has turned positive and traders are buying on dips. That could improve the prospects of a rally to $1.05.
Alternatively, if the price turns down and breaks below the moving averages, it will suggest that the recent breakout may have been a bull trap. The pair could then decline to $0.69.
Shiba Inu’s (SHIB‘s) recovery fizzled out near the 20-day EMA ($0.000011) and the price has declined to astrong support at $0.000010.
The downsloping moving averages and the RSI below 37 suggest that bears have the upper hand. If the price breaks below $0.000010, the SHIB/USDT pair could drop to $0.000009 and thereafter to the crucial support at $0.000007.
If bulls want to prevent the pair from going downhill, they will have to quickly push the price above the 20-day EMA. The pair could then rise to the 50-day SMA ($0.000011) and thereafter to $0.000014.
The views and opinions expressed here are solely those of the author and do not necessarily reflect the views of Cointelegraph.com. Every investment and trading move involves risk, you should conduct your own research when making a decision.
